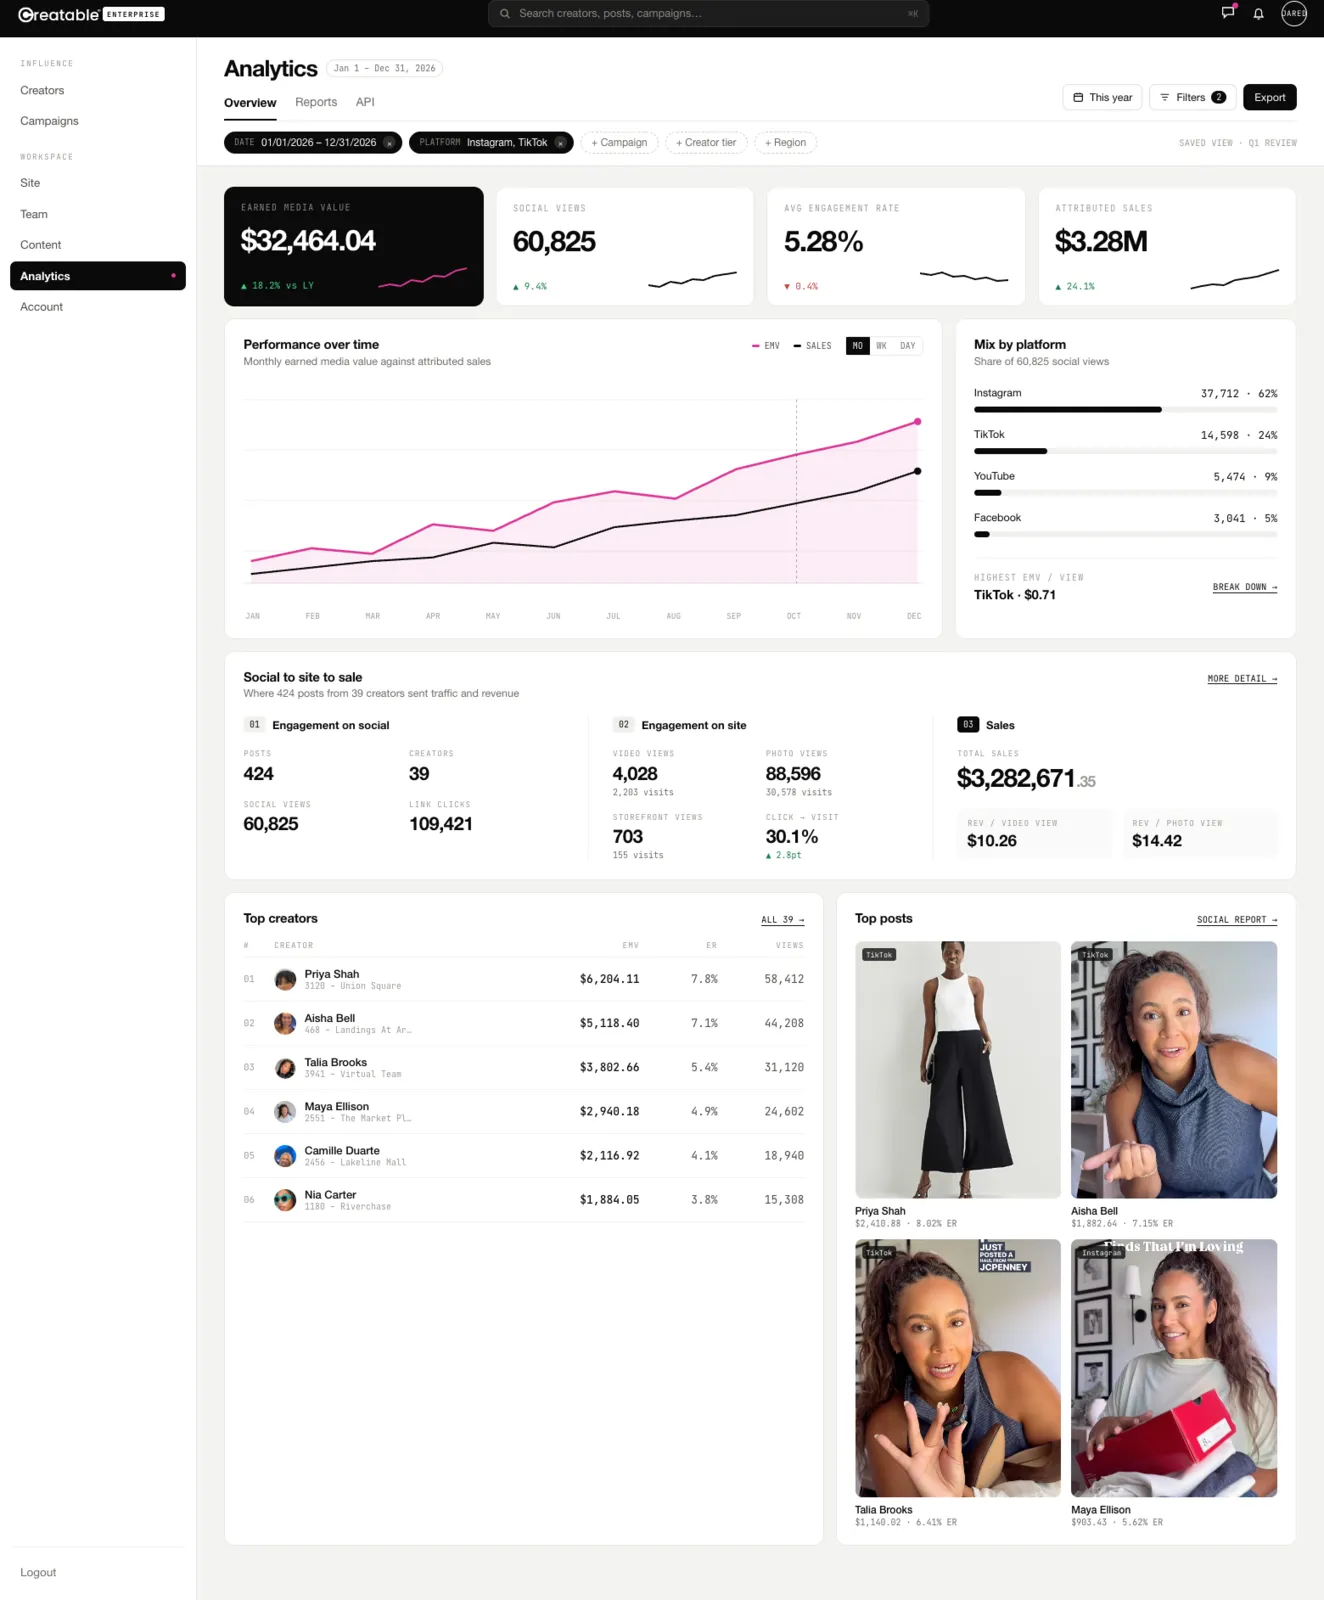
Half the creator funnel lives on social. The other half lives on your site. Nobody measures both — so nobody can say what a creator was worth. Track joins them: one dashboard, seven purpose-built reports, one published definition per metric, and every number queryable by API.
Social tells you reach and engagement. Your analytics tells you sessions and orders. Neither one tells you that this creator's third video sold $6,204 of product on your PDP last month — because nothing joins the two halves at the asset level.
Track owns both sides: on-site content views and trackable creator links from one install, plus unauthenticated social data per post. Then it reconciles against real orders instead of estimating.
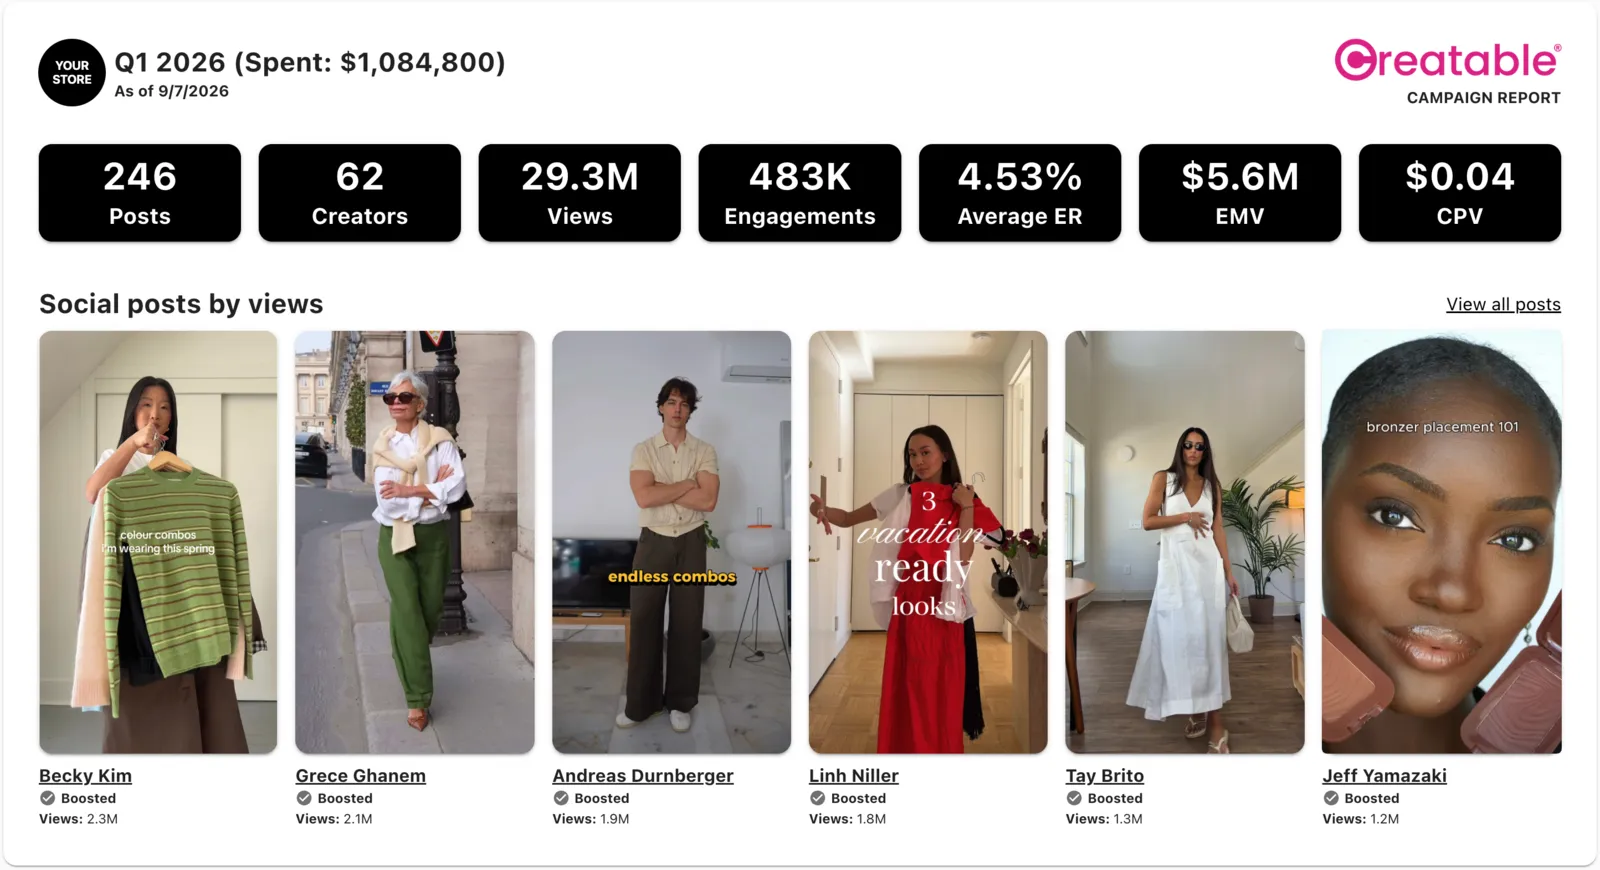
Impressions, engagements and rate per post — not just per account — across Instagram, TikTok and YouTube, with organic and boosted separated and audience data attached.
Views and visits treated as different things, broken out by content type and tagged per experience — PDP carousel, storefront, flip feed, app.
Four event sources — video, photo, product link, storefront — four kinds of sale, one rule: a 30-day window, multi-touch or last-click, your choice.
Filter once and the filter follows you everywhere; export anything. Engagement, sales, conversion, revenue per basket and AOV all come broken out by content type — so you can see who moves the needle, and where.
Creator insights, product-level data and channel comparison come standard — plus one published definition for every metric, so two teams reading the same number mean the same thing.
One pixel install protects the whole dataset. You own the site half — on-site content views and trackable creator links — and the social half arrives unauthenticated, so a creator does not have to connect an account for you to measure them. Both join to your stack on your keys.
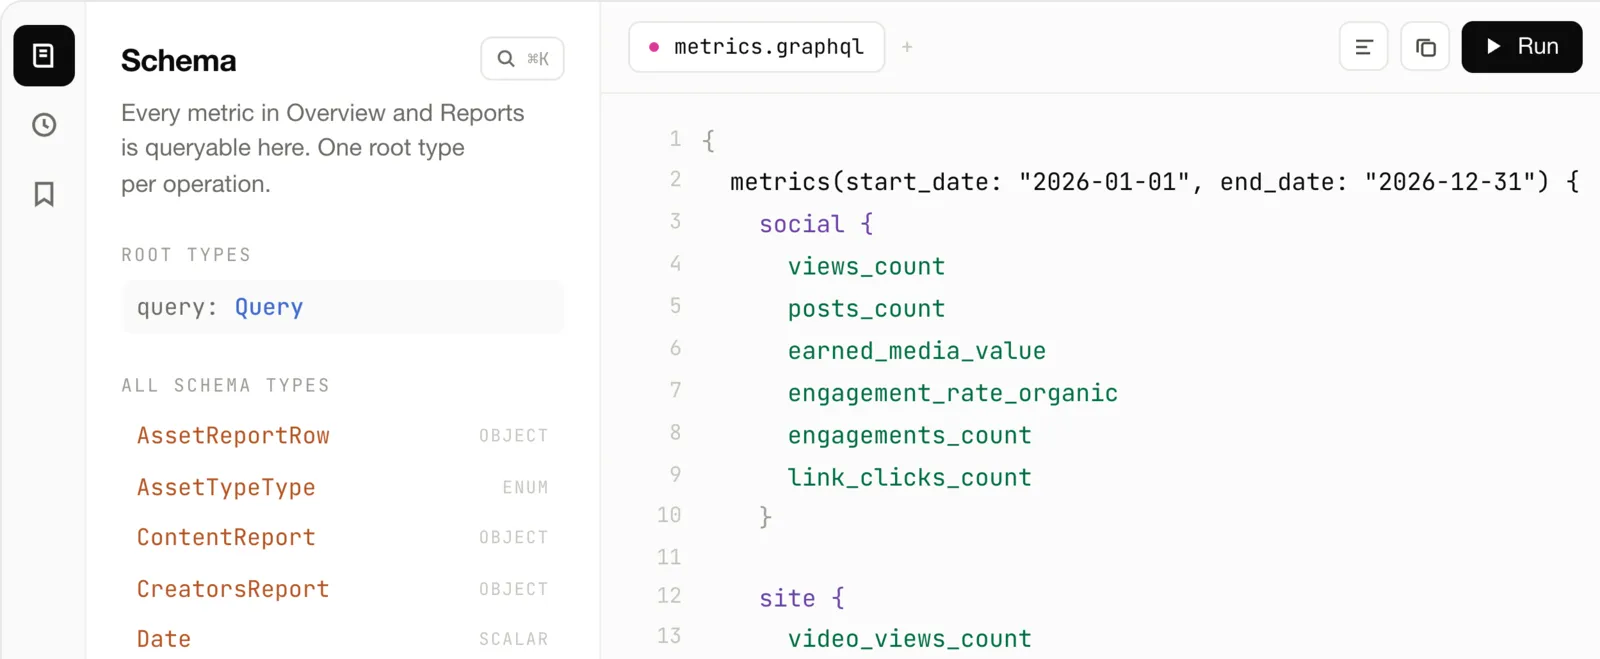
One GraphQL request returns the whole funnel — social, site and sales as types, reports as types. Wire it into your executive dashboard, your BI tool, Adobe or GA, or bulk-export it. Five indexes share one join key, so measurement can turn into prediction: cast by data, brief by evidence, merchandise by signal.
Find the high-ROI creators and pay them more.
Detect content gaps and underperforming assets.
Test employee against affiliate against influencer.
Feed the learning back into the next activation.
Install the sitewide link-tracking pixel and read the funnel in your first hour.



A defensible dollar value on social performance
Earned media value, calculated transparently: impressions × CPM × an adjustment variable you can see and challenge. Every post carries a dollar value, the creator is named, the store is named, and organic is separated from boosted.
EMV is the floor, not the ceiling. Where creator content also runs on site, brands see 2.5–3× the value of the social impression alone.